TL;DR — the short answer
If you are reading this because someone on your buying committee has asked the question "can we measure productivity without keystrokes, screenshots, and webcam feeds," the short answer is yes, and the deeper answer is that the surveillance signals were never measuring what you thought they were measuring in the first place. Keystroke counts correlate close to zero with knowledge-work output. Screenshot frequency correlates with role bias, not productivity. Webcam attention tracking has been retired in every defensible 2026 rollout I have seen. The replacement is not a different surveillance signal — it is a different shape of measurement entirely.
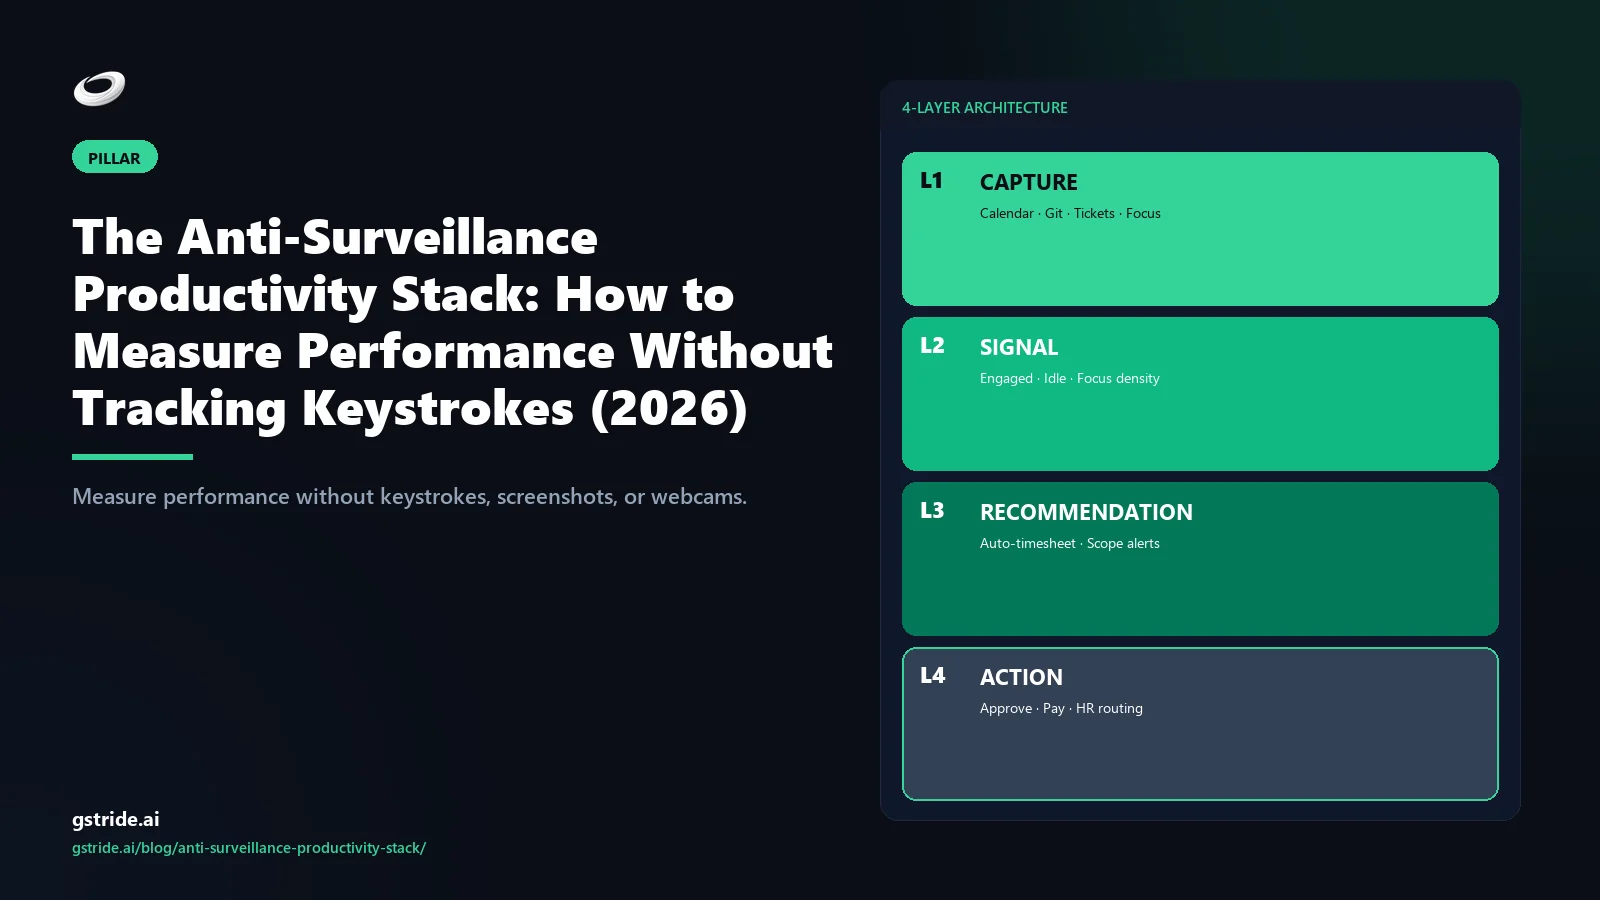
- The architecture is the answer. A four-tool stack — capture, signal, recommendation, action — built on API integrations with tools the team already uses, not a desktop agent capturing wide behavioural data.
- Six measurement primitives do the real work. Focus mosaic, cycle-time and throughput, async velocity, meeting drag, capacity-vs-demand fit, idle drift. Each one derives from a work artifact the IC has already produced.
- Five red flags retire the vendor. Keystroke logging buried in the feature list, screenshot defaults, mouse-activity tracking, no IC self-inspection, no audit trail on AI decisions.
- Thirty days is the right pilot shape. Calendar capture only in Week 1, focus mosaic baseline in Week 2, recommendation evaluation in Week 3, manager action loop in Week 4.
- The regulatory hedge has hardened. GDPR Article 22, the EU AI Act effective August 2026, and India's IT Rules 2021 / DPDP Act 2023 all push surveillance stacks into high-risk classification while outcomes-based intelligence sits in the low-risk band.
This pillar consolidates the wedge cluster gStride has been building for six months — productivity monitoring without surveillance, the alternative to keystroke tracking, Time Doctor alternatives without screenshots, how AI detects idle time, how often to take employee screenshots. Each of those covered one wedge of the argument. This is the consolidated framework that ties them together.
The surveillance trap (three failure modes)
The surveillance stack — keystroke counts, screenshots, mouse activity, webcam feeds, idle-minute thresholds — has been the default monitoring substrate for roughly two decades. It survives because it produces numbers that move on a chart, not because the numbers correlate with shipping. Three specific failure modes show up reliably enough that any buyer evaluating this category should be able to recognise them on sight.
Failure mode 1 — Measurement validity collapse
The first and most consequential failure is that the signals captured do not correlate with the outcome being claimed. A 2023 Gartner analysis reported that electronically monitored employees were roughly twice as likely to actively fake productivity as their non-monitored peers, and Microsoft's 2022 Work Trend Index named the gap "productivity paranoia" — 85 percent of leaders said hybrid work made it harder to trust employees, while 87 percent of employees said they were productive. The gap is exactly what surveillance dashboards try to close and what they reliably make worse. I have watched a 64-employee IT services scenario where the keystroke dashboard ranked the senior architect 9th out of 12 ICs — the same engineer responsible for roughly 35 percent of the team's high-impact features that quarter. The dashboard is measuring keypresses, not value, and the two are weakly related at best.
The mechanism is not subtle. Knowledge work splits roughly evenly between producing artifacts (typing, coding, drafting) and consuming them (reading, reviewing, thinking, listening). Keystroke counts capture the first cleanly and miss the second entirely. Roles with more read-mode work — engineering deep dives, research, architecture, customer calls, strategy — register as systematically less productive than roles with more type-mode work — data entry, transcription, copy production. The category that has been retired in every team I have observed is "productivity score per IC" because the score reliably correlates with role profile rather than output.
Failure mode 2 — Team trust erosion
The second failure mode is downstream of the first and harder to recover from. When ICs realise the dashboard is mis-ranking them, the response splits into two categories — adapt or leave. The adapters game the metric. Keystroke generators are free, undetectable by the keystroke-tracker itself, and trivial to install. Across the three customer-team migrations I have helped move off keystroke-default platforms, 15 to 40 percent of the keystrokes on the pre-migration dashboard were generated by software, not by humans. The leavers are the bigger cost — they tend to be the senior ICs who have options, and they leave first. A mid-market BPO buyer I observed last quarter lost two senior team leads inside ninety days of rolling out screenshot-default monitoring; the exit interviews surfaced "I do not work somewhere I am photographed every fifteen minutes" with remarkable consistency.
The compounding cost is the people who quietly leave. The pattern repeats across every team I have audited: the best engineers, the senior designers, the principal analysts — the people you most want to retain — treat the surveillance stack as a signal about how the organisation thinks about them. They are right to. The category that gets it right does not need a separate trust-recovery program because it does not break trust to begin with.
Failure mode 3 — Legal and compliance exposure
The third failure mode is the one that has hardened sharply through 2026. Three regulatory instruments now materially constrain what surveillance stacks can be deployed.
GDPR Article 22 — restricts automated decision-making that produces significant effects on data subjects. Keystroke or screenshot-based AI scoring that affects pay, promotion, or termination triggers Article 22, which requires meaningful human intervention, the right to contest, and the right to an explanation. AI scoring with no shown reasoning fails this test on the explanation clause alone.
EU AI Act (effective enforcement August 2026) — classifies AI systems used to monitor or evaluate employees as high-risk under Annex III. The obligations are substantive — conformity assessment, lawful basis documentation, technical documentation, human oversight, transparency to data subjects, accuracy and robustness testing, post-market monitoring. AI scoring that ranks employees with no shown reasoning sits closest to the prohibited-practice line. Outcomes-based intelligence with explainable signals and human-in-the-loop recommendations sits in the low-risk band. The deeper compliance map is in our GDPR-compliant employee monitoring 25-point checklist.
India's IT Rules 2021 (Sensitive Personal Data) and the DPDP Act 2023 — treat keystroke capture and screenshot capture as sensitive personal data requiring explicit consent and a documented purpose. The DPDP Act's enforcement mechanism (the Data Protection Board) and the breach-notification clock (72 hours) materially raise the cost of getting consent wrong. Most surveillance-default platforms I have audited treat the India deployment as a thin localisation rather than a substantive compliance lift; the gap is large enough that an Indian mid-market buyer should treat it as a procurement blocker. The broader legality picture is in is employee monitoring legal in 2026.
Six outcomes-focused measurement primitives
If the surveillance signals fail on measurement validity, trust, and compliance, the question becomes what to measure instead. The list below is the working set I have arrived at after watching mid-market teams pilot the category for two years. Six primitives, each defensible against the surveillance temptation, each producing recommendations a manager can act on, each measurable in a 30-day window.
Primitive 1
Focus mosaic
What it measures. Deep-work blocks above a configurable threshold (45 minutes default) and the fragmentation pattern of the working week. How it is derived. Calendar metadata plus app/window context — which application is foreground during the block, no keystrokes captured. Why it beats keystrokes. Calendar fragmentation is the strongest predictor of knowledge-work throughput I have measured. Keystroke counts during a deep-work block correlate near-zero with the cognitive depth of the work happening in it.
Primitive 2
Cycle time and throughput
What it measures. Time a ticket, PR, or deliverable sits in any state versus team baseline; committed scope shipped per cycle. How it is derived. Project tracker (Jira, Linear, Asana, ClickUp) and repo (GitHub, GitLab) APIs. Why it beats screenshots. Cycle time is the actual output signal — what got shipped, how long it took. Screenshots tell you where the IC's screen was pointed. Different shape of data, different shape of intervention.
Primitive 3
Async velocity
What it measures. Median response latency on decisions that should not require a meeting — code review approvals, design sign-offs, contract redlines, ticket dispositions. How it is derived. Repo, project tracker, and document-system metadata (response timestamps, not message contents). Why it beats activity tracking. Async velocity catches the team that is meeting-bound by default — a structural blocker invisible to keystroke counts and visible immediately in response latency above 24 hours on routine decisions.
Primitive 4
Meeting drag
What it measures. Share of a role's week consumed by meetings the person did not initiate, broken down by recurring versus one-off and by meeting category. How it is derived. Calendar metadata only — meeting organiser, attendee role, recurrence pattern, declared category. Why it beats activity tracking. Meeting drag surfaces the gap between meeting load owners (managers, schedulers) and meeting load bearers (ICs). The intervention is calendar surgery, which a keystroke dashboard cannot ever recommend because it does not see the calendar.
Primitive 5
Capacity-vs-demand fit
What it measures. Committed work in the next 2 weeks versus the team's rolling 4-week throughput, adjusted for declared time off, known meeting load, and queue depth. How it is derived. Project tracker plus calendar plus declared leave system. Why it beats hours tracking. Capacity-vs-demand catches over-commitment before the sprint starts rather than after it slips. Hours tracked tells you what happened. Capacity-vs-demand tells you what is about to happen, which is the only signal a manager can intervene on usefully.
Primitive 6
Idle drift
What it measures. Pattern-based detection of disengagement — calendar gap plus stalled ticket plus async silence plus declined or unresponded meetings — across a rolling window. How it is derived. Multi-signal fusion from calendar, ticketing, and async metadata, not screenshot frequency or keyboard inactivity. Why it beats threshold idle. A 5-minute keyboard-inactivity flag fires during a 30-minute focused review. Pattern-based idle drift fires only when multiple work signals agree, which produces actionable diagnoses instead of false-idle noise. The deeper treatment is in how AI detects idle time.
What is notable about this list is what is not on it. Not keystrokes. Not mouse activity. Not screenshots. Not webcam feeds. Not idle-minute counts in isolation. Every primitive either reads from a tool the team already uses or derives from work artifacts the IC has already produced. The capture footprint is narrow on purpose — and the recommendations that come out of it are still substantially more actionable than anything a wide-surveillance feed produces. The longer wedge-by-wedge breakdown is in the alternative to keystroke tracking.
The four-tool anti-surveillance stack
The simplest way to evaluate any 2026 vendor in this category is to walk through their architecture in four tools — capture, signal, recommendation, action. A platform that handles all four with narrow capture and IC inspection rights is the actual category. A platform that stops at any one of them, or that achieves any one of them through wide capture, is selling something different.
Tool 1 — Capture (API-first integrations, not desktop spyware)
The capture layer reads work signals from the tools that already produce them. For a knowledge-work team that means calendar (Google Calendar, Outlook), project tracker (Jira, Linear, Asana, ClickUp), code repository (GitHub, GitLab, Bitbucket), document system (Google Docs, Notion, Confluence), and communication metadata (Slack response latency, never message contents). The architectural test is whether the platform requires a desktop agent capturing keystrokes, screenshots, and mouse activity or works off API integrations with tools the team already uses. API-first is the right shape. Wide-agent capture is surveillance, even when the marketing says analytics.
The hybrid — agent-optional with the agent disabled by default — is acceptable if the analytics layer produces useful signal without the agent. If turning off the agent disables the core analytics, the platform is structurally surveillance and the API-first promise is a sales talking point rather than a product reality. Run this test in the demo: ask to see the analytics view with the desktop agent uninstalled. If the view collapses, you are evaluating a keystroke and screenshot tool with a dashboard.
Tool 2 — Signal (focus mosaic plus cycle telemetry)
The signal layer is where raw captured data becomes a pattern a human can act on. A calendar feed becomes a focus mosaic — the fragmentation pattern of the working week. A ticketing-system feed becomes a cycle-time distribution with outliers flagged. A repo feed becomes throughput cadence and async velocity. A meeting feed becomes meeting drag percentage per role. The signal layer is where most legacy "analytics" vendors stop and call themselves complete — and where most 2026 buyers should keep walking.
The architectural test for the signal layer is explainability. When the platform says "your team's focus mosaic dropped 14 percentage points this week," can you click into the signal and see which calendar events, which meeting categories, which IC schedules contributed to the drop? Black-box signal layers fail EU AI Act Annex III high-risk obligations (effective August 2026) and, more practically, cannot be debugged when the model is wrong. The deeper category framing is in what productivity intelligence actually means.
Tool 3 — Recommendation (Monday-morning move)
The recommendation layer is where a signal becomes a specific intervention a manager can read in plain language on Monday morning. "Your team's meeting drag exceeded 38 percent for the engineering team last week" is a signal. "Cancel the Thursday 11am all-hands for the next two weeks and protect 90 minutes of morning focus for the 6 engineers showing fragmentation above the team baseline" is a recommendation. The first is interesting. The second is what a manager actually does on Monday.
A platform that produces real recommendations has to know enough about the work to propose actions that fit it — which is the part most pure-analytics tools cannot do because they live above the work. The platforms that can produce recommendations are the ones that also live inside the tools where the work happens. Data proximity matters, and a recommendation that the manager has to translate into an action outside the analytics tool is just a more elaborate chart caption.
Tool 4 — Action (in-platform — block focus, rescope, approve)
The action layer closes the loop. The recommendation gets actioned in-platform with one click — calendar block created, recurring meeting paused, ticket escalated, workload rebalanced — or it gets routed for human approval and then actioned. After the action, the platform measures whether the originating signal shifted. Did the focus mosaic recover after the calendar block was applied? Did cycle time drop after the ticket was escalated? The feedback closes the loop and trains the next recommendation.
A platform without an action layer is structurally a slightly smarter dashboard. The manager still has to leave the analytics tool, open Google Calendar, manually block time, then come back next quarter to see if anything moved. That round-trip is where most analytics ROI evaporates. The category-defining shape is all four tools, end to end, in one platform — and the test that separates real platforms from dashboard SaaS is whether the action loop closes inside the tool that produced the signal.
The rule I apply to every AI feature gStride ships: if the recommendation cannot be actioned in the platform that produced it, the analytics is incomplete. A dashboard that requires the manager to leave the tool to do anything is a tax on attention, not a productivity layer.
The full architectural breakdown — including the deeper treatment of each layer, the explainability test, and the implementation reference — is in our companion Pillar #3 on AI workforce analytics, which covers the four-layer architecture as a buyer's framework. This pillar consolidates the anti-surveillance argument that underpins it.
Five vendor red flags in a 2026 demo
Five patterns reliably indicate that what is being sold as anti-surveillance productivity software is really surveillance with a different wrapper. Any one of them is sufficient grounds to walk away. The vendor lift to remediate any of them is multi-quarter, which means promises during a sales cycle do not count.
A vendor that markets itself as privacy-first or AI-first and ships keystroke logging as a configurable feature deep in the admin settings is shipping the wrong category by default. The architectural test is whether keystroke capture exists in the product at all — not whether it is on or off by default. A product that captures keystrokes is structurally a keystroke product, and the dashboard tab is the marketing wrapper, not the architecture. The deeper wedge is in the alternative to keystroke tracking.
Screenshots earn their place in narrow, opt-in scenarios — billable-hour client transparency, regulated-industry audit trail, specific incident investigation. Outside those, mandatory screenshot capture is surveillance with the worst signal-to-cost ratio in the category. A platform that bundles analytics with screenshots-on-by-default and no per-feature toggle has shipped surveillance and will not pass a 2026 privacy review in most jurisdictions. Screenshot-heavy trackers sit at this end of the spectrum — see gStride vs DeskTime for how a screenshot-interval tool compares with behavior-signal productivity intelligence. The deeper screenshot framework is in how often should you take employee screenshots.
Mouse activity correlates near-zero with knowledge-work output and correlates strongly with role bias — it over-credits typing-heavy roles and penalises reading-heavy roles. The 2026 marketing trick is to rebrand mouse tracking as "engagement signal" or "attention metric" and surface it in the dashboard as a positive frame. The architectural reality is unchanged — it is a wide-capture surveillance signal that fails on validity, trust, and compliance. A vendor that ships mouse-activity-as-engagement is selling the same product under a friendlier name.
The single strongest predictor of whether an analytics rollout is accepted by the team is whether the IC can see exactly what the manager sees about them, in the same UI. A platform where managers have a dashboard ICs cannot inspect is structurally surveillance — even if the captured signals look defensible — because the asymmetry is the surveillance, not the data. This is the 90-second demo test: open the IC view and ask whether everything the manager can see about an IC is visible to that IC. If the answer is no, the platform is out. The deeper treatment is in productivity monitoring without surveillance.
When the platform produces a signal — "this IC's focus mosaic is fragmented above team baseline" — can you click into it and see which inputs contributed, when the model was retrained, and what the model version was? If the AI is a black box with no shown reasoning and no audit log, the platform fails GDPR Article 22 (right to explanation), EU AI Act Annex III (transparency and human oversight obligations), and DPDP Act 2023 (purpose limitation and data principal rights). Black-box AI in workforce contexts is a hard no in 2026, regardless of how good the marketing copy is.
A 30-day pilot framework
Thirty days is the right pilot shape for replacing surveillance with outcomes-based intelligence. Long enough to see the focus mosaic and cycle-time signals stabilise across two full sprint cycles. Short enough to make a decision before procurement fatigue takes over. The framework below has worked for a 64-employee IT services scenario I observed running it last quarter — they came out of Day 30 with seven closed-loop recommendations, three signals turned off as undeployed, and a clear yes-or-no on the platform.
Week 1 — Calendar capture only and policy draft
Connect calendar integrations and the project tracker. Do not connect screenshot capture, keystroke logging, or any desktop agent. Draft the measurement policy covering purpose, scope, signals captured, retention windows (default 30 days unless documented otherwise), access controls (team aggregate by default, IC drilldown by explicit purpose), IC inspection rights (everything visible to manager visible to IC), and recommendation governance (who approves an action before it is applied). Share the policy with the team in writing before any manager-level analytics view opens. Pilot week 1 is plumbing and paperwork, not insights — and skipping it is the single most reliable way to break the rollout.
Week 2 — Focus mosaic baseline (IC view first)
Compute the focus mosaic baseline for every IC. Each IC sees their own data first — uninterrupted blocks above the threshold, fragmentation patterns, meeting drag percentage, async velocity. Invite ICs to flag any signal that feels disproportionate to the policy from Week 1. Log every configuration change made on IC feedback — it becomes evidence of proportionality in any later challenge. For the 64-employee IT services scenario I tracked, Pilot week 2 ended at 87 percent data coverage on focus mosaic with 4 ICs flagging meeting-drag granularity as too fine — meeting categories were collapsed to defensible buckets and coverage held above the baseline through Week 4.
Week 3 — Recommendation evaluation
Turn on the recommendation layer. Every flagged signal in Week 3 must produce either a specific recommendation the manager can read in plain language (cancel this recurring meeting, protect this calendar block, escalate this stalled ticket) or a documented decision not to act. Signals that produce neither across the week are surveillance debt — flag for removal at the Week 4 retro. This is the pilot week most at risk of slipping back into surveillance creep if the policy from Week 1 was not specific enough. The mitigations are policy clarity (Week 1), IC inspection rights (Week 2), and recommendation discipline (Week 3 itself).
Week 4 — Manager action loop and signal feedback
Close the loop. Every approved recommendation gets applied in-platform with one-click manager approval — calendar block created, recurring meeting paused, ticket escalated, workload rebalanced. After each action, the platform measures whether the originating signal shifted. Did the focus mosaic recover after the calendar block was applied? Did cycle time drop after the ticket was escalated? Run the Day 30 retro: count closed-loop interventions, turn off undeployed signals, and write the procurement decision — keep, replace, or escalate. For the IT services scenario, 87 percent of pilot weeks hit the baseline focus mosaic coverage target — the platform stayed.
The five-question vendor test
Five questions, in order. They sit on top of the four-tool architecture, the six measurement primitives, and the five red flags — and they are designed to fail the vendor fast. If a vendor cannot give you a credible answer to question one, you do not need questions two through five. This list extends the five-question framework in Pillar #3 on AI workforce analytics with the explicit anti-surveillance lens.
1. Does the platform capture only via API integrations with tools the team already uses, or does it require a desktop agent capturing keystrokes, screenshots, or mouse activity?
The architectural question. An API-first platform reading calendar, tickets, repos, docs, and chat metadata is the right shape. A platform that requires a desktop agent capturing wide behavioural data is surveillance, regardless of the marketing copy. The hybrid is acceptable only if the analytics produces useful signal with the agent disabled. Run the test in the demo: ask to see the analytics view with the agent uninstalled. If the view collapses, the platform is out.
2. Does the analytics layer terminate at signal, or does it produce a specific recommendation the manager can read on Monday morning?
Walk the demo through one realistic scenario. The platform flags that meeting drag exceeded 38 percent for the engineering team last week. What does the platform recommend? "Review your meetings" is not a recommendation, it is a chart caption. "Cancel the Thursday 11am all-hands for the next two weeks and protect 90 minutes of morning focus for the 6 ICs showing fragmentation above the team baseline" is a recommendation. If the demo cannot show a recommendation that specific, the platform is a dashboard with marketing.
3. Can the recommendation be actioned in the platform with one-click manager approval?
Continue the scenario. The recommendation is to cancel the Thursday 11am all-hands and protect 90 minutes of morning focus. Can the manager apply that in the analytics platform with one click — calendar block created, attendees notified, recurring meeting paused for two weeks — or does the manager have to leave the tool, open Google Calendar, and manually edit each event? Action-in-platform is the difference between a closed loop and a manager tax.
4. Is every signal inspectable by the IC in the same UI the manager sees?
The 90-second demo test. Open the IC view. Show me everything the manager can see about a single IC. Is it all visible to that IC in their own view? If anything is gated — a productivity score, an attention metric, a per-week behavioural rating — the platform is structurally surveillance and will damage trust before it produces value. This is non-negotiable in any defensible 2026 rollout.
5. Does the AI explain its reasoning, and is the explanation logged in an audit trail the IC can read?
When the platform produces a signal, can you click into it and see which inputs contributed, when the model was retrained, and what the model version was at the time of the decision? Under GDPR Article 22 the IC has a right to an explanation. Under EU AI Act Annex III the platform has a transparency obligation. Under DPDP Act 2023 the data principal has inspection rights. A platform that fails on AI explainability fails on all three regulatory instruments simultaneously, and in 2026 that is a procurement blocker rather than a nice-to-have.
How gStride implements the anti-surveillance stack
I will be direct about what gStride does in this category, because the rest of this pillar is harder to evaluate without a concrete reference. gStride captures via API integrations with calendar, project tracker, repo, document system, and chat metadata — no desktop agent required for the analytics layer. The six measurement primitives above (focus mosaic, cycle time, async velocity, meeting drag, capacity-vs-demand fit, idle drift) are computed with per-signal explainability — every chart drills into the underlying inputs the IC can also see in the same UI the manager uses. Recommendations are produced inline against each signal and can be actioned in-platform — calendar blocks applied, recurring meetings paused, tickets escalated, workload rebalanced — with one-click manager approval and a documented audit trail on every AI decision.
EU AI Act compliance is built in by design — explainable signals, human-in-the-loop recommendations, IC inspection rights, documented retention policy, model version logging. GDPR Article 22 is handled through the explanation and dispute path. India's IT Rules 2021 and DPDP Act 2023 are addressed through narrow capture (calendar plus tickets, not keystrokes plus screenshots) and explicit consent on any signal that crosses the sensitive personal data line. The platforms that need to layer in payroll integration and shift, leave, and attendance for India-fit or BPO-fit rollouts can do that on the same data substrate — the consolidation saved roughly INR 28,000 per month in tool spend for one mid-market BPO buyer I observed last quarter, but the calculation only mattered because the buyer was already paying for three separate tools.
Frequently asked questions
Free: 5-Signal Productivity Self-Audit Worksheet
30-min audit on your team. Focus depth + commit cadence + meeting load + flow-state + blocker recovery. PDF + Google Sheets calc. For Ops Heads, Founders, Eng Managers.
Frequently asked questions
Is keystroke logging illegal?
Keystroke logging is not categorically illegal in most jurisdictions, but the threshold to justify it has hardened through 2026. Under GDPR it triggers Article 35 impact-assessment obligations, and EU regulators have issued enforcement actions against employers using it without strict necessity, transparency, and proportionality. Under the EU AI Act (August 2026), AI that interprets keystroke data to evaluate employees carries Annex III high-risk obligations. Under India's DPDP Act 2023, keystroke capture requires explicit consent and a documented purpose. Outcome-signal alternatives sit on safer ground — verify with counsel.
Can you measure productivity without screenshots?
Yes, in every knowledge-work context I have observed. The signals that genuinely correlate with shipped work — focus mosaic, cycle time, async velocity, meeting drag, capacity-vs-demand fit, blocker resolution — all derive from work artifacts the team already produces in calendar, project tracker, repo, and document system. Screenshots add capture overhead, legal exposure, and trust drag without improving diagnostic accuracy. The narrow case where screenshots earn their place is billable-hour client transparency with explicit IC opt-in — and even there, an event-triggered sample beats continuous capture.
What replaces screenshot monitoring in 2026?
The replacement is outcomes-based productivity intelligence — a measurement stack that reads work signals from the tools the team already uses (calendar, tickets, repos, docs, chat metadata), classifies them into team-level patterns (focus blocks, cycle-time outliers, blocker concentration, meeting drag), and closes the loop with specific recommendations the manager can action in the platform. The capture footprint is narrow, the analysis layer is IC-inspectable, and the recommendation layer turns signals into Monday-morning moves. The category that gets it right never needed screenshots in the first place.
Does the EU AI Act ban keystroke and screenshot monitoring?
The EU AI Act does not categorically ban keystroke or screenshot monitoring, but its high-risk classification of workplace AI under Annex III (effective August 2026) makes deploying them substantially harder. Employers must complete a conformity assessment, document the lawful basis, ensure human oversight, provide explainability, and grant data subject rights. AI scoring that ranks employees with no shown reasoning sits closest to the prohibited line. Outcome-based productivity intelligence with explainable signals and human-in-the-loop recommendations remains deployable with far less compliance lift — verify with counsel.
What is the anti-surveillance productivity stack?
The anti-surveillance productivity stack is the architectural alternative to keystroke and screenshot monitoring — a four-tool platform that captures work signals via API integrations (no desktop spyware), classifies them into outcomes-focused measurement primitives (focus mosaic, cycle time, async velocity, meeting drag, capacity-vs-demand fit, idle drift), produces specific recommendations a manager can action in the platform, and exposes every signal to the IC in the same UI the manager sees. The capture footprint is narrow, the analysis is explainable, and the loop closes inside the tool.
How do you measure deep work without keylogging?
Read the calendar, not the keyboard. A deep-work block is an uninterrupted stretch of calendar time above a configurable threshold (45 minutes is the common default) with no meetings, recurring blockers, or calendar-declared interruptions scheduled. The focus mosaic signal aggregates these blocks across a working week and benchmarks them against the team's rolling 4-week baseline. Calendar metadata is sufficient to produce the signal and trains the right manager intervention — calendar surgery, not surveillance. Keystroke counts during a deep-work block correlate near-zero with the cognitive depth of the work.
What metrics replace activity tracking for remote teams?
Six measurement primitives consistently outperform activity tracking for remote knowledge-work teams: focus mosaic from calendar metadata; cycle time and throughput from project tracker and repo; async velocity from response latency on commits and tickets; meeting drag from calendar overhead patterns; capacity-vs-demand fit from queue depth and escalation rates; and idle drift detected as a pattern across multiple signals rather than a 5-minute keyboard-inactivity flag. Every primitive derives from a work artifact the IC has already produced and surfaces a recommendation a manager can action.
How long does an anti-surveillance pilot take?
Thirty days is the right shape. Week 1 connects calendar integrations and drafts the measurement policy — no manager-level analytics view opens yet. Week 2 baselines the focus mosaic for every IC, who sees their own data first and flags any signal that feels disproportionate. Week 3 evaluates the recommendation layer — every flagged signal must produce a specific recommendation or a documented decision not to act. Week 4 closes the manager action loop with one-click in-platform approvals. By Day 30 the platform either closes loops or it goes back.
What are the red flags in productivity software?
Five reliable red flags signal that productivity software is surveillance with a different wrapper: keystroke logging buried in the feature list; screenshot capture defaulted on with no granular opt-out; mouse-activity tracking marketed as engagement or attention signal; no IC self-inspection view, so the IC cannot see what the manager sees about them; and no audit trail on AI decisions. Any one of these is sufficient grounds to walk away — the vendor lift to remediate any of them is multi-quarter, so sales-cycle promises do not count.
Is productivity intelligence the same as time tracking?
No. Time tracking captures hours against tasks and is fundamentally a billing instrument. Productivity intelligence reads work signals across calendar, project tracker, repo, and async tools, classifies them into outcomes-focused patterns, and recommends specific interventions to remove blockers, protect focus, and rebalance workload. Time tracking answers 'how many hours did this take?' Productivity intelligence answers 'where is the work stuck and what should the manager do about it?' Most mid-market buyers in 2026 need productivity intelligence with time tracking as a thin billing layer underneath.
Free: Employee Monitoring Policy Template (2026)
An 8-section .docx/.pdf shell aligned to GDPR Article 13, EU AI Act, UK ICO 2023, and DPDP — drop it into your handbook, edit placeholders, run it past counsel. Free, no card.
Free: CISO Procurement Checklist for AI Productivity Vendors
10 questions every CISO should ask before signing — data residency, DPIA, AI auditability, breach SLA, retention, SCIM/SSO, sub-processors, right to audit. Includes scoring rubric and pass / hold / walk thresholds.
Related reading on gStride
- AI Idle Detection vs Keystroke Logging — what each actually measures in 2026
- Pillar #3 — AI Workforce Analytics: The Complete 2026 Buyer's Guide
- Pillar #1 — AI Time Tracking Software: The Complete 2026 Buyer's Guide
- Productivity Monitoring Without Surveillance: What Actually Works
- The Alternative to Keystroke Tracking: 5 Signals That Predict Productivity
- Time Doctor Alternative Without Screenshots: 5 Privacy-First Tools
- gStride vs DeskTime — screenshot intervals vs behavior-signal productivity intelligence
- How AI Detects Idle Time (Without False Positives)
- How Often Should You Take Employee Screenshots?
- How to Track Productivity Without Monitoring Employees
- Is Employee Monitoring Legal in 2026?
- GDPR-Compliant Employee Monitoring: A 25-Point Checklist
- Employee Productivity Software ROI Calculator
- gStride Playbook — anti-surveillance policy templates
- gStride feature map
- gStride pricing
- Productivity intelligence platform vs employee monitoring — the category split
- Compare gStride against 13 productivity & monitoring tools
Run the 30-day anti-surveillance pilot with your team
Download the anti-surveillance measurement policy template from the gStride playbook — eight required sections, retention defaults, IC inspection rights, recommendation governance, ready to adapt for a 30-day pilot. Or pressure-test the framework against your current vendor with the ROI calculator.
Get the policy template Run the ROI calculator