
The pain — verbatim from the founder call
"You can't tell if employee works 12 hours productively or 4 hours productively. No intelligence-based measurement beyond clock-in/clock-out."
— An Ahmedabad IT services CEO with 7+ years running the firm, on an advisor call, April 2026
That sentence is the single most accurate description we have heard of the small-IT measurement problem in India in 2026. The CEO who said it runs a 60-employee services shop in Ahmedabad — half developers, half support and analyst roles — and his appraisal cycle is once a year. Between appraisals, the only operational signal he has on a per-employee basis is the punch-card view: when the laptop opened, when it closed, and the manager's eyeballs on what happened in between. The manager's eyeballs are perception, not measurement, and they degrade fast under any team load above about 6 to 8 direct reports.
This is the problem clock-in/clock-out cannot solve, and it is the problem AI productivity intelligence platforms have been built to solve over the last 24 months.
Why traditional time tracking fails — three reasons
1. Presence is not value
The first failure is structural. Clock-in/clock-out is a presence instrument. The signal it captures is "the laptop was open from 09:14 to 21:08." That signal is silent on what happened in those 11 hours and 54 minutes. It cannot distinguish four merged pull requests from one half-finished commit. It cannot distinguish three resolved customer tickets from eight hours of context-switching across Slack, Outlook, and a half-watched team training session. Both days produce identical punch-card output. Both go into the same monthly hours-logged report. And the appraisal-cycle conversation six months later treats them as equivalent.
2. Hours-logged inflates with meetings
The second failure is meeting load. Small Indian IT shops, particularly those servicing international clients, are now running developers through three to five hours per day of standup, sprint planning, client review, internal review, and one-on-one calls. Every one of those hours counts the same on the punch card as deep-work code time. A developer who logged 11 hours across seven meetings and three context-switched coding sessions clocks as a 11-hour-productive day. The manager sees the time; the manager does not see that 8 of the 11 hours were meeting load and the remaining 3 were context-switched fragments shorter than a 30-minute focus block.
3. Self-reported hours are easy to game
The third failure compounds the first two. Many small IT shops have moved to self-reported daily hours — the developer enters their own timesheet at end-of-day. The advisor we spoke with put it bluntly in a separate quote: "80% of developers cannot deliver within their own estimated hours. If developers set their own hours, they game the system to look good." The self-reported number is upward-biased, the manager has no independent signal to verify it against, and the appraisal cycle ends up reasoning over data that has been pre-massaged.
The 12-hours-vs-4-hours math — a concrete example
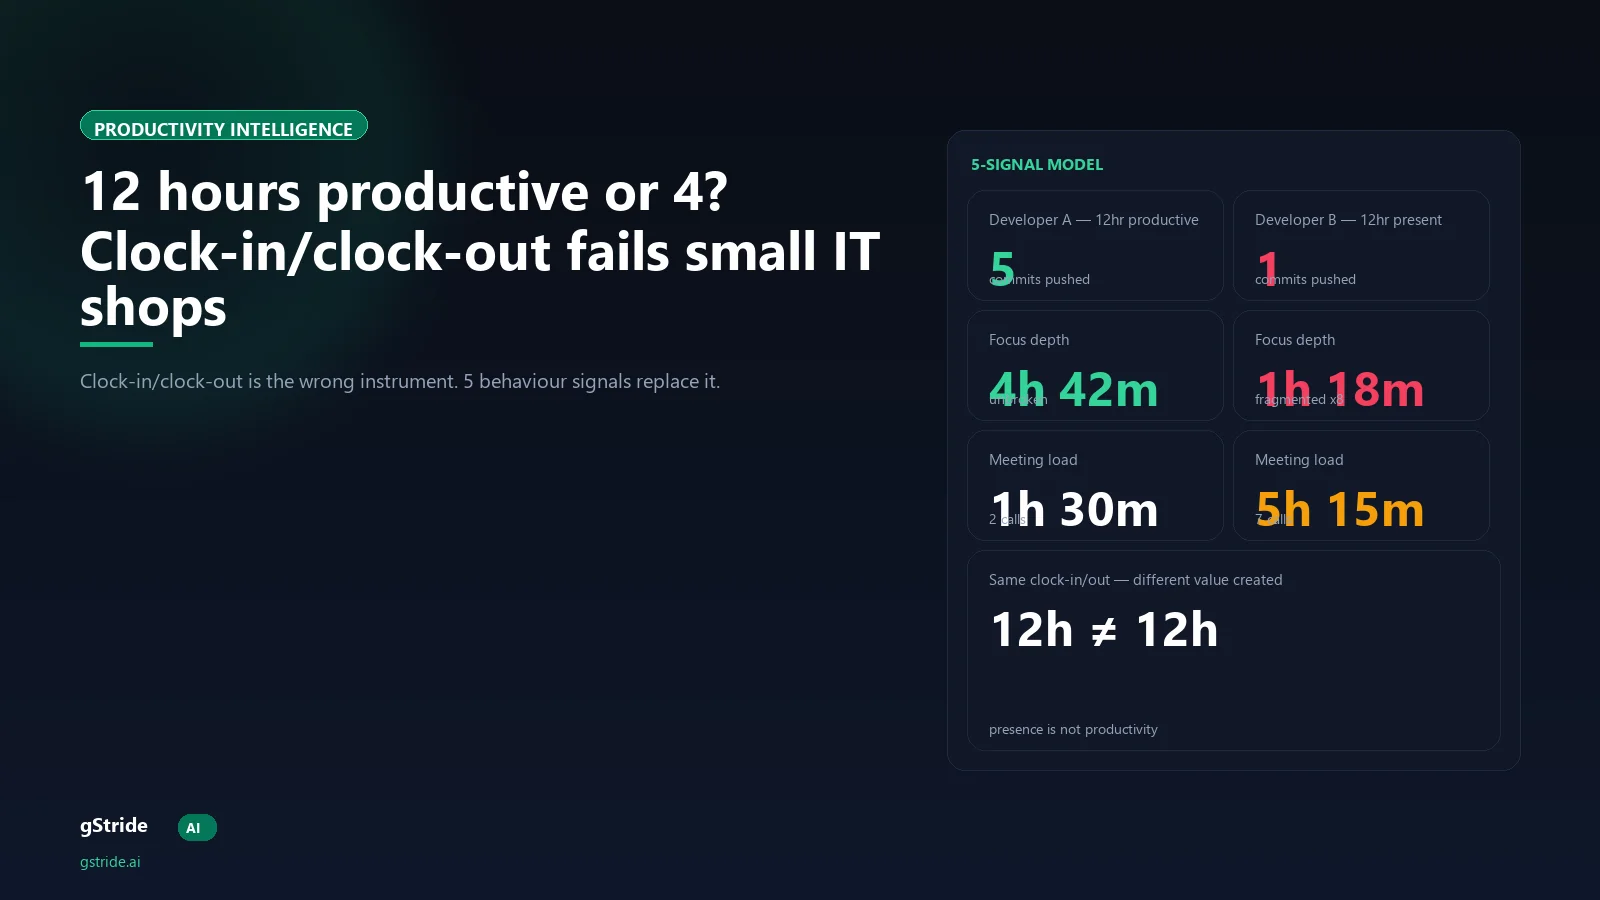
Take two developers on the same team at the same Ahmedabad shop, both logging 12-hour days through a sprint.
| Signal | Developer A (12-hour-productive) | Developer B (12-hour-present, 4-hour-productive) |
|---|---|---|
| Focus depth on IDE | 4h 42m unbroken | 1h 18m, fragmented across 8 sessions |
| Meeting load | 1h 30m, 2 calls | 5h 15m, 7 calls |
| Slack switches | 14 | 87 |
| Commits pushed | 5 | 1 |
| Tickets moved to review | 3 | 0 |
| Flow-state minutes (90+ min uninterrupted) | 183 | 0 |
| Clock-in / clock-out | 12h 04m | 12h 11m |
The punch-card view treats these two days as equivalent. They are not. Developer A shipped a sprint's worth of output; Developer B spent the day on meeting-driven context-switching and did not deliver a single ticket. The signal layer makes that gap visible inside the same week, not nine months later inside an appraisal-cycle conversation that is already inflected by the manager's recency bias.
What AI productivity intelligence measures instead — the 5 behaviour signals
The five signals below are the working measurement model behind every modern AI productivity intelligence platform — and the model gStride uses on its productivity monitoring feature by default. None of them require screenshots, keystrokes, or content capture. All five operate at the operational-metadata layer.
1. Focus depth
The share of an employee's day spent in a single application or window without context-switching beyond a threshold (typically 30 to 60 seconds of foreground time per switch). High focus depth on the IDE, on a writing tool, on a design surface, or on a customer-support console correlates strongly with shipped output. Low focus depth — many short switches — correlates with context loss, slower delivery, and higher cognitive cost. Focus depth is the single most predictive signal in small-team data.
2. Commit cadence
For engineering roles, the rhythm of commits, pull requests, and code reviews across the day. A developer producing 4 to 7 commits across the working day with a steady cadence has a healthy delivery shape. A developer producing 0 commits one day and 22 the next typically has a meeting-overload or blocker problem on the zero-day. Commit cadence reads from Git metadata; it does not require any code-content access.
3. Meeting load
Total calendar-blocked time across the day plus the count of distinct meetings. A developer with 5+ hours of meeting time has almost no chance of producing a flow-state hour that day; the calendar shape physically precludes it. Meeting load is the most reliable predictor of low-output days, and it is invisible on a punch card. The platform reads it from calendar metadata — no transcript, no audio, no video access.
4. Flow-state minutes
The count of uninterrupted blocks of 90 minutes or more spent in a single primary application. Flow-state minutes are the strongest correlate with deep-work output — design work, code work, writing work, analysis work. A developer with zero flow-state minutes in a given day has not had the calendar shape to do their primary job, regardless of total hours logged. Flow-state minutes are the signal that converts "12 hours" into "12 hours that produced what they could have produced."
5. Blocker recovery time
The interval between an employee hitting a blocker (idle on a file, switching back-and-forth between editor and browser, opening a Stack Overflow tab, posting in Slack) and resuming focus on the original task. Short blocker recovery (under 8 minutes) is healthy — the developer found the answer and got back. Long blocker recovery (over 25 minutes) is a flag for either a hard technical problem or an unaddressed dependency on another team. Surfacing it to the manager and the employee turns a silent productivity loss into a triable conversation.
The 30-day deployment playbook
The five signals only matter if they get deployed in a way employees accept and managers actually use. The playbook below is the deployment shape we have seen work at small Indian IT shops (30 to 150 employees) over the last 12 months. Full deployment-pilot detail is in our productivity intelligence pilot framework; the summary below is the small-IT compression.
Week 1 — agent rollout
Install the desktop agent silently across the engineering team. No scoring shown to the employees. No manager dashboards live. The platform is in capture-only mode. The point of week 1 is to verify the agent is running cleanly, the data is flowing, and there are no false-positive alerts on legitimate work patterns (deep IDE focus reading as "idle" for example).
Week 2 — baselining
The platform learns each employee's normal pattern. A senior architect's focus shape is different from a junior developer's; a customer-support analyst's pattern is different from both. The platform reads two weeks of activity, settles a per-employee baseline, and surfaces aggregate team-level signal to the engineering manager only. Individual-level dashboards are still off.
Week 3 — dashboard launch with self-view day one
The critical week. The five signals go live in the manager dashboard and in the employee self-view — on the same day. Every employee on the platform can open their own dashboard and see exactly what the manager sees about their work shape. This inversion is what separates a productivity intelligence rollout from a monitoring rollout. The anti-surveillance stack we have written about previously is the architectural detail of why self-view-day-one matters.
Week 4 — manager training and appraisal-cycle integration
Engineering managers and HR sit through a half-day session on how to read the five-signal dashboard, what conversations the signal supports, what conversations it does not support (the signal is not a substitute for the manager-employee one-on-one), and how the year-round signal feeds the next appraisal cycle. The HR side maps focus density, flow-state minutes, and shipped tickets onto the existing review template so the appraisal cycle starts pulling from the platform rather than from the manager's recency memory.
What this changes for the founder we opened with
The Ahmedabad CEO who put the original question — 12 hours productively or 4 — is not unique. Every small Indian IT shop founder we have spoken with through 2025 and 2026 has the same gap. The instrument they have been handed (clock-in/clock-out, sometimes layered with self-reported timesheets) cannot answer the question. The instrument that can answer it is signal-led — five behaviour signals, surfaced to both manager and employee, accumulated across the appraisal cycle, integrated into the review template on the HR side.
For the founder, the operational change is: the next appraisal cycle is grounded in a year of per-employee signal rather than the manager's last two months of perception. The talent retention change is: top performers see their own work shape reflected in the platform and stop losing the appraisal-conversation to the louder peer who got more manager-time. The cost change is: meeting overload becomes visible in the first month and becomes triable rather than tolerated.
None of that is possible on a punch card. All of it is table-stakes on the platform shape that has replaced the punch card in 2026.
Free: 5-Signal Productivity Self-Audit Worksheet
30-min audit on your current team using five behaviour signals (focus depth, commit cadence, meeting load, flow-state minutes, blocker recovery). PDF + Google Sheets calc. For Ops Heads, Founders, Eng Managers at 25-300 emp Indian IT shops.
Free: CISO Procurement Checklist for AI Productivity Vendors
10 questions every CISO and IT-services CEO should ask before signing — data residency, DPIA, AI auditability, breach SLA, retention, SCIM/SSO, sub-processors, right to audit. Includes scoring rubric and pass / hold / walk thresholds.
Further reading on gStride
Frequently asked questions
Why can't clock-in/clock-out tell you whether someone worked 12 hours productively or 4?
Clock-in/clock-out records presence — the moment the laptop opens and the moment it closes. It does not record what happened in between. Two employees can clock identical 12-hour days; one produced four merged pull requests, three resolved tickets, and two hours of pair-review, the other produced one half-finished commit and eight hours of meeting-and-context-switching. Presence-tracking instruments cannot distinguish those two days. AI productivity intelligence measures the work signal — focus density, commit cadence, meeting load, flow-state minutes, blocker recovery — and surfaces the difference between hours-logged and value-created.
Is this just employee monitoring with a new name?
No. Employee monitoring captures content (screenshots, keystrokes, URLs) and surfaces it to the manager. Productivity intelligence captures operational metadata (focus density, calendar load, ticket flow, commit cadence) and surfaces it to both the manager and the employee being measured. Monitoring features in a productivity-intelligence platform ship off by default and are configurable per role with a documented justification and audit log. The 5 behaviour signals described here all sit at the metadata layer, not the content layer.
What does "focus depth" actually measure?
Focus depth is the share of an employee's day spent in a single application or window without context-switching beyond a threshold (typically 30-60 seconds of foreground time per switch). A developer with 240 minutes of IDE focus has a high-focus day; one with 12 minutes of IDE focus broken by 47 Slack switches has a fragmented day, regardless of clock hours. It is one of the strongest correlates with shipped code in small-team studies.
How long does a deployment take at a 50-100 employee Indian IT shop?
30 days end-to-end on the playbook described in this article. Week 1 is agent rollout (silent capture, no scoring shown to employees, no manager dashboards live). Week 2 is baselining (the platform learns each employee's normal pattern). Week 3 is dashboard launch with the self-view enabled for every employee on day one. Week 4 is manager training plus appraisal-cycle integration. Most small IT shops are running on year-round signal by day 45.
Will employees push back on the signal layer?
They push back on monitoring tools because monitoring is asymmetric — the manager sees, the employee does not. They tend not to push back on productivity intelligence when the self-view ships day one and surfaces the same signal the manager sees. Once an employee opens the self-dashboard, sees their own focus density, and realises the platform also flags the meeting overload hurting their day, the conversation shifts from surveillance to fair measurement.
Does this work for hybrid and fully remote developers?
Yes, and arguably it works better. Office-based clock-in/clock-out has the (weak) signal of physical presence; remote clock-in/clock-out has nothing. The agent-based capture is identical regardless of location — the platform reads commit cadence, ticket flow, focus density, and meeting load whether the developer is in the Ahmedabad office, working from Pune, or on a six-week visit to a client in the UK. The signal is location-agnostic by design.
How does this connect to appraisals and increments?
Year-round signal replaces last-two-months perception. The appraisal manager can open a 12-month focus-density chart per employee, a 12-month commit-cadence trend, a 12-month meeting-load comparison, and a 12-month flow-state-minutes total. The increment decision moves from manager recency bias to documented signal across the cycle. We have a dedicated appraisal-cycle integration playbook that walks the HR side through the merge of signal and review-template.
What is the lightest-weight first deployment for a 50-employee shop?
Start with focus density and commit cadence on the engineering team only. Skip screenshots entirely. Ship the self-view on day one. Use the signal in a single weekly retro (manager-employee, 15 minutes) for four weeks. Measure the delta in shipped tickets versus the prior month. Most teams hit a 12-18% throughput lift on the first cycle just from making meeting load and context-switching visible to both sides. Then expand to the rest of the company in month two.
See the 5-signal model on real engineering data
Focus depth, commit cadence, meeting load, flow-state minutes, blocker recovery — all in a 15-minute walkthrough. Self-view enabled day one. No screenshots.
Book a 15-min demo Read the category definitionQuotes from a real advisor call have been anonymised — the Ahmedabad IT services CEO referenced gave the founder feedback in a private call and is not publicly named. Operational data points are anonymised across multiple small-IT customer deployments. The 5-signal model is the working measurement framework on the gStride platform as of May 2026.