
The pain — verbatim from the founder call
"WFH accountability is zero. Remote work visibility is non-existent for most small Indian IT companies. We don't know what remote employees are actually doing during the day."
— A 200-employee Indian data services firm owner, on an advisor call, April 2026
The firm runs a mixed analyst-engineer team across three Indian cities and one US client-coverage shift. Two-thirds of the team is fully remote; the rest is hybrid two-days-in. The owner's honest assessment is that he has zero per-employee operational signal on the remote workforce. The only data points are end-of-day Slack messages and weekly status standups — both self-reported, both easy to embellish, both silent on the gap between "I had a productive day" and what the day actually looked like.
His specific worry is not surveillance — he is explicit that he does not want a screenshot tool. His worry is the asymmetry: he has signal on his office-based team (he can walk past their desk, he can read the room) but no equivalent signal on his remote team. Project profitability is degrading; client delivery is getting late; he cannot tell whether the cause is workload mis-allocation, blocker accumulation, or something he does not have visibility into. The instrument he has been handed (screenshot monitoring) carries downside he is not willing to accept. The instrument he needs (operational signal at the metadata layer) is the gap this article exists to close.
Why screenshots fail — four reasons
1. Tampering — mouse-jigglers and second-monitor decoys
The first failure is technical. Mouse-jigglers (USB devices that simulate mouse movement, costing ₹400-1,200) are now standard remote-work accessories at scale. Screen-overlay scripts (showing a fake IDE while the actual screen shows YouTube) are 200-line Python files available on GitHub. Second-monitor decoys (one monitor showing real work, the other showing whatever the employee actually wants to do) defeat single-screen screenshots entirely. The screenshot signal carries roughly 30 seconds of tamper-resistance — well below what a motivated employee needs to defeat it. The signal exists, but it does not reliably tell you what the employee was doing.
2. Privacy backlash — the personal-information leak
The second failure is human. Screenshots capture whatever is on the employee's screen at the moment of capture, which includes — across a typical work week — banking tabs, medical communication, personal DMs, family-related search history, and political content. Employees have a reasonable expectation of privacy on those, even on a company laptop. The capture is asymmetric (manager sees, employee does not see their own captures back), and the backlash is real — the survey data we see in customer rollouts consistently shows screenshot policies as the single largest driver of stated "looking for a new job" intent among the technical workforce.
3. EU AI Act ban — regulatory exposure on European clients
The third failure is legal. The EU AI Act Article 5 and Annex III restrict AI systems for workplace inference that can materially affect employment decisions in ways the employee cannot meaningfully contest. Screenshot-based productivity inference is within scope, and several variants are now restricted outright for European workforce data. Any Indian IT services firm with European clients — a very large share of the small-IT market — faces direct exposure: a single complaint from a European-based employee or an audit by a European client's procurement team can produce a finding that forces process changes mid-contract. We covered the full EU AI Act time-tracking compliance posture in detail; the screenshot question is the loudest specific exposure.
4. Attrition — the 1.5-3x voluntary-exit lift
The fourth failure compounds the first three. Every customer rollout we have observed where a screenshot policy was introduced after a no-screenshot baseline correlated with a 1.5-3x increase in voluntary attrition within the following 12 months. The lift was concentrated in the top quartile of the team — the developers and analysts the firm could least afford to lose. Replacing a top-quartile engineer in 2026 India costs roughly 6-9 months of their salary in recruiting, ramp time, and team-velocity loss. The screenshot policy's "productivity gain" is overwhelmed by the personnel-cost loss within the first year, before any of the regulatory or backlash effects compound.
The 5 behaviour signals that replace screenshots
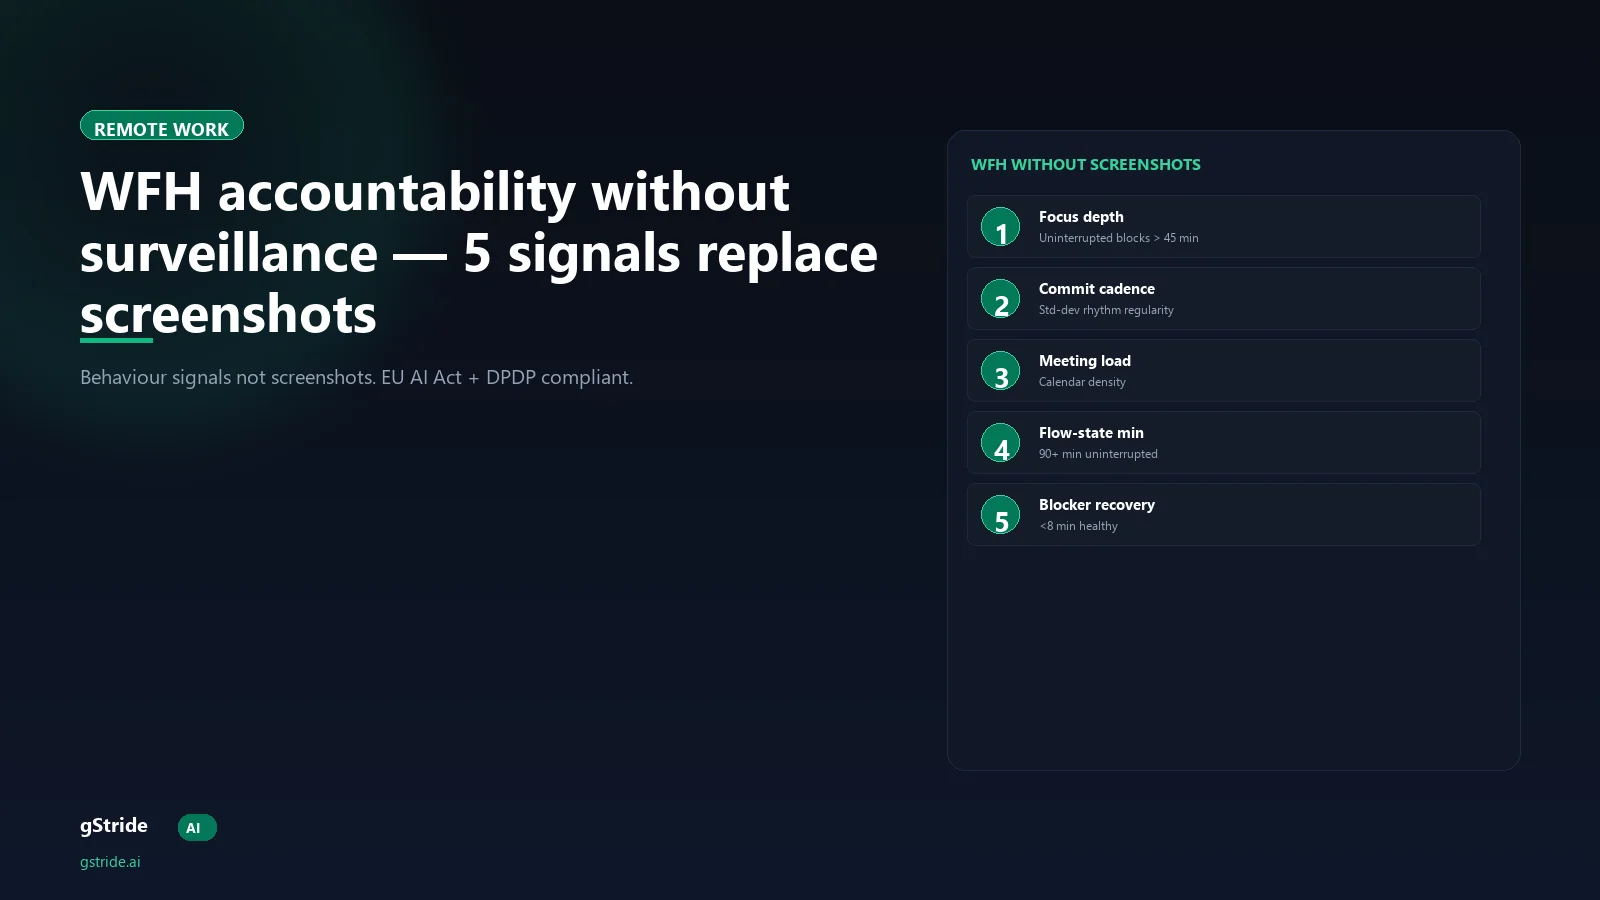
The five signals below sit at the operational-metadata layer. None require screen capture, keystroke logging, or content access. The signal model is the working measurement framework on the gStride productivity monitoring feature and is the foundation of the anti-surveillance productivity stack we have written about previously. Teams switching off a capture-led tool can see the same model applied as an Insightful alternative that skips screenshots.
Signal 1 — Focus depth
The share of the employee's day spent in a single application or window without context-switching beyond a 30-60 second foreground-time threshold. High focus depth on the IDE, on a writing tool, on a design surface, or on a customer-support console correlates strongly with shipped output. The signal reads from the OS active-window event stream — never from window content. Gaming resistance: high. Mouse-jigglers do not move foreground-application time meaningfully; a tampered focus signal looks exactly like an untampered idle signal, which is itself useful data.
Signal 2 — Commit cadence (or domain equivalent)
For engineering roles, the rhythm of commits, pull requests, and code-review iterations across the day. For non-engineering — tickets closed for customer support, calls completed and dispositioned for sales, documents shipped for content, queries resolved for data analyst roles. The signal reads from the system-of-record API (Git, Zendesk, Salesforce, JIRA). Gaming resistance: high. Empty commits show as empty; tickets marked "done" that are not actually done get reverted by the next reviewer; the metadata is structurally hard to inflate.
Signal 3 — Calendar density
Total calendar-blocked time across the day plus the count of distinct meetings. A remote employee with five-plus hours of meeting load has almost no chance of producing flow-state hours that day; the calendar shape physically precludes it. The signal reads from calendar metadata — no transcript, no audio, no video. Gaming resistance: high. Meeting count and total blocked time are calendar-system-of-record values.
Signal 4 — Ticket flow
Items moved through the ticketing/project-management system, by status transition (in-progress, review, blocked, done). The signal aggregates per-employee throughput per sprint and surfaces deviations from the seniority benchmark. Reading from JIRA, Linear, Asana, ClickUp, or equivalent. Gaming resistance: medium-high. Tickets moved to "done" without acceptance get reverted; tickets opened-and-closed without intermediate work show as suspicious patterns.
Signal 5 — Blocker recovery
The interval between an employee hitting a blocker (idle on a file, repeatedly switching between editor and browser, opening Stack Overflow tabs, posting in a help-channel) and resuming focus on the original task. Short recovery (under 8 minutes) is healthy. Long recovery (over 25 minutes) signals a hard technical problem or an unaddressed cross-team dependency. Gaming resistance: medium. The signal is the hardest to gain by surface-level behaviour, and the cross-validation against the other four catches most attempts.
Free: Employee Monitoring Policy Template (5 jurisdictions)
Drop-in employee monitoring policy template — India DPDP Act, EU GDPR + AI Act, UK GDPR, US California CCPA, Singapore PDPA. Legal-basis statement, data categories, retention, employee rights, grievance procedure. Used by 40+ small-to-mid IT firms in 2026.
Deployment playbook — 200-employee remote-first firm
The end-to-end deployment for a 200-employee firm runs 35-45 days. The shape compresses the 30-day playbook we have documented for engineering-only rollouts; the difference is the SSO/SCIM provisioning step and the multi-team manager-training cycle.
Days 1-10 — Silent-capture baseline
SSO and SCIM provisioning. Desktop agent rollout in capture-only mode across the engineering and analyst teams. No scoring shown to employees. No manager dashboards live. The platform validates clean signal flow and false-positive-free idle detection. The privacy posture is documented and shared internally as part of the employee monitoring policy. The legal-basis statement is logged.
Days 11-20 — Per-employee benchmarking
The platform learns each employee's normal pattern. A senior architect's focus shape differs from a junior developer's; an analyst's pattern differs from both. The platform settles a per-employee baseline across two weeks of activity. Aggregate team-level signal surfaces to the engineering manager and analyst manager only; individual-level dashboards remain off.
Days 21-30 — Dashboard launch with day-one self-view
The five signals go live in the manager dashboard and in the employee self-view — on the same day. Every employee on the platform can open their own dashboard and see exactly what their manager sees about their work shape. This is the inversion that distinguishes productivity intelligence from monitoring. The employee monitoring policy is communicated team-wide with the dashboard launch.
Days 31-40 — Manager training and HR-process integration
Engineering managers, analyst managers, and HR sit through a half-day session per group on how to read the five-signal dashboard, what conversations the signal supports, and how the year-round signal feeds the next appraisal cycle. The HR side maps the signals to the existing review template so the appraisal-cycle conversation pulls from documented data rather than from manager recency memory.
Days 41-45 — Final calibration and operational handover
Edge-case calibration on a few teams (the analyst team that does heavy phone work needs a softer focus-depth threshold; the support team needs ticket-flow weight increased relative to commit cadence). Operational handover from the rollout team to the platform's own dashboard owner. Documentation finalised; runbook handed to the firm's internal IT team.
Outcome — the composite picture at day 45
On the founder's question — "we don't know what remote employees are actually doing during the day" — the day-45 outcome looks like this. Every remote employee has a five-signal dashboard the manager and the employee see in parallel. Project-profitability degradation has documented causes (we can name the meeting-load problem on Team A, the blocker-accumulation pattern on Team C, the senior-overload pattern on the architecture team) rather than untraceable causes. Late client deliveries have signal-grounded explanations the founder can take into the client conversation. The 1.5-3x attrition lift that would have come with a screenshot rollout does not happen.
The composite outcome, drawn from anonymised mid-size customer deployments: meeting-load rebalancing across the first 60 days typically recovers 4-7 hours per developer per week, ticket-flow throughput improves 15-22%, blocker-recovery latency drops 25-35% (because the signal makes blockers visible early), and the operational-signal asymmetry between office and remote employees is eliminated. The founder is now reading the team the way he was reading the office before — but on documented metadata signal rather than informal observation.
Further reading on gStride
Frequently asked questions
Why is WFH accountability so low at small Indian IT companies?
Two structural reasons. First, most small Indian IT companies do not have any operational signal on remote employees — the only data point is end-of-day Slack messages and weekly status standups, both self-reported and easy to embellish. Second, the only instruments most owners know about (screenshot monitoring, keystroke logging) carry significant downside — they trigger employee backlash, increase attrition risk, are now restricted under EU AI Act for any team serving European clients, and are easily defeated by mouse-jigglers. The result is a binary choice between zero accountability and surveillance — and most owners choose zero rather than risk the team.
Why do screenshots fail as an accountability instrument?
Four reasons. (1) Tampering — mouse-jigglers, screen-overlay scripts, and second-monitor decoys defeat the signal in 30 seconds of setup. (2) Privacy backlash — screenshots capture personal information (banking tabs, medical communication, private DMs) that the employee has reasonable expectation of privacy on, even on a work laptop. (3) Regulatory ban — the EU AI Act classifies screenshot-based workplace AI inference as a high-risk system and bans several variants of it; any team serving European clients faces direct exposure. (4) Attrition — every customer rollout we have observed correlates screenshot policies with a 1.5-3x increase in voluntary attrition within 12 months. The signal is unreliable, legally exposed, and personnel-cost-negative.
What are the 5 behaviour signals that replace screenshots?
(1) Focus depth — share of the day spent in a single application or window without context-switching beyond a 30-60 second threshold. (2) Commit cadence — rhythm of git commits, PRs, and code reviews across the day for engineering roles; equivalent for non-engineering (tickets closed for support, calls completed for sales). (3) Calendar density — total calendar-blocked time and distinct meeting count, read from calendar metadata. (4) Ticket flow — items moved through the ticketing/project tool, by status transition. (5) Blocker recovery — interval between hitting a blocker and resuming focus on the original task. All five sit at the operational-metadata layer; none require screen capture or keystroke logging.
Will this work for a 200-employee remote-first firm?
Yes. The five-signal model scales linearly with team size — the platform reads OS-level active-window signal, Git metadata, calendar metadata, and ticketing-system status transitions across any team size. The deployment shape for 200 employees is roughly 35-45 days end-to-end: 10 days for the silent-capture baseline, 10 days for the per-employee benchmarking, 10 days for the dashboard launch with day-one self-view, and the rest for manager training and HR-process integration. Larger deployments include an SSO and SCIM provisioning step; 200-employee firms with a managed identity provider usually clear that in a week.
How is this different from monitoring software like Hubstaff or Time Doctor?
Monitoring software (Hubstaff, Time Doctor, ActivTrak, Insightful, Teramind) captures content — screenshots, keystroke logs, URL history, application titles. Productivity intelligence captures operational metadata only — focus density, commit cadence, calendar load, ticket flow, blocker recovery. The platform never reads what the employee typed, never screenshots the screen, never captures URL history. The signal is also bilateral — every employee can open their own self-dashboard and see exactly what the manager sees about their work shape. Monitoring software is asymmetric; productivity intelligence is symmetric by design.
What does the EU AI Act actually ban?
The EU AI Act Article 5 and Annex III restrict the use of AI systems for workplace inference that could affect employment decisions in ways the employee cannot meaningfully contest. Screenshot-based AI productivity scoring, keystroke-based engagement inference, and emotion-recognition systems in workplace contexts are within scope. Any Indian IT services firm with European clients (a very large share of the small-IT market in 2026) needs a defensible AI-governance posture, and screenshot-based monitoring is now an active liability. The five-signal model, by contrast, operates at operational-metadata layer with documented AI auditability, which is the compliance-friendly posture.
How do you prevent employees from gaming the signals?
Each signal has a different gaming-resistance profile. Focus depth is hard to game without actually focusing (mouse-jigglers do not move foreground-application time meaningfully). Commit cadence is hard to game because it reads from Git metadata — empty commits show as empty. Calendar density and meeting count are hard to game because they are calendar-system-of-record signals. Ticket flow is hard to game because items moved to "done" that are not actually done get reverted by the next reviewer. Blocker recovery is harder to game than the others — but the cross-validation between signals catches most patterns. The honest answer: any single signal can be gamed; the five-signal composite is hard to game in any meaningful way.
Can we mix this with screenshot monitoring for high-risk roles?
In tightly defined cases — compliance-sensitive roles, role-specific data-handling functions, contractually mandated audit-trail requirements — screenshot capture remains a defensible posture if the role-specific justification is documented, the audit log is maintained, the data residency is in-region, and the employee has signed an informed-consent acknowledgement. The platform supports configurable per-role policies. The 95% case is that screenshots are off by default for everyone; the 5% case is a defended exception with documented governance. The blanket-team-wide screenshot policy is the failure mode we are arguing against.
What does the WFH accountability dashboard look like for a manager?
A manager opens the dashboard and sees per-employee focus-depth-by-day, commit-cadence-by-week, meeting-load-by-week, ticket-throughput-by-sprint, and blocker-recovery-trend across 90 days. The view is signal-trend not screenshot-grid. Comparisons are by seniority benchmark, not by absolute number. The manager can drill into any signal for a one-on-one conversation; the employee can drill into the same data for self-coaching. The dashboard does not surface URL history, applications, or content of any kind.
How does this connect to the employee monitoring policy?
The five-signal model needs to be documented in the employee monitoring policy regardless of whether screenshots are also captured. Most jurisdictions (GDPR in Europe, India's DPDP Act, US state laws) require the company to inform employees about workplace monitoring practices in writing. The platform ships with a template policy in 5 jurisdictions. The policy template specifies what is captured, what is not, the legal basis (legitimate interest plus consent for monitoring features beyond signal layer), retention, employee access rights, and the grievance procedure. The policy is a precondition for the platform deployment, not an afterthought.
Replace screenshots with the 5-signal model — book a free audit
30-min audit of your current WFH visibility posture. Per-team baseline + signal-replacement roadmap. No screenshots, no keystroke logging.
Book a free WFH audit Or book a 30-min walkthroughThe 200-employee Indian data services firm owner quoted gave the founder feedback in a private advisor call and is not publicly named. Attrition-lift ranges and outcome metrics are drawn from anonymised aggregate data across multiple mid-size customer deployments. The 5-signal model and 35-45-day deployment shape are the working framework on the gStride platform as of May 2026.