
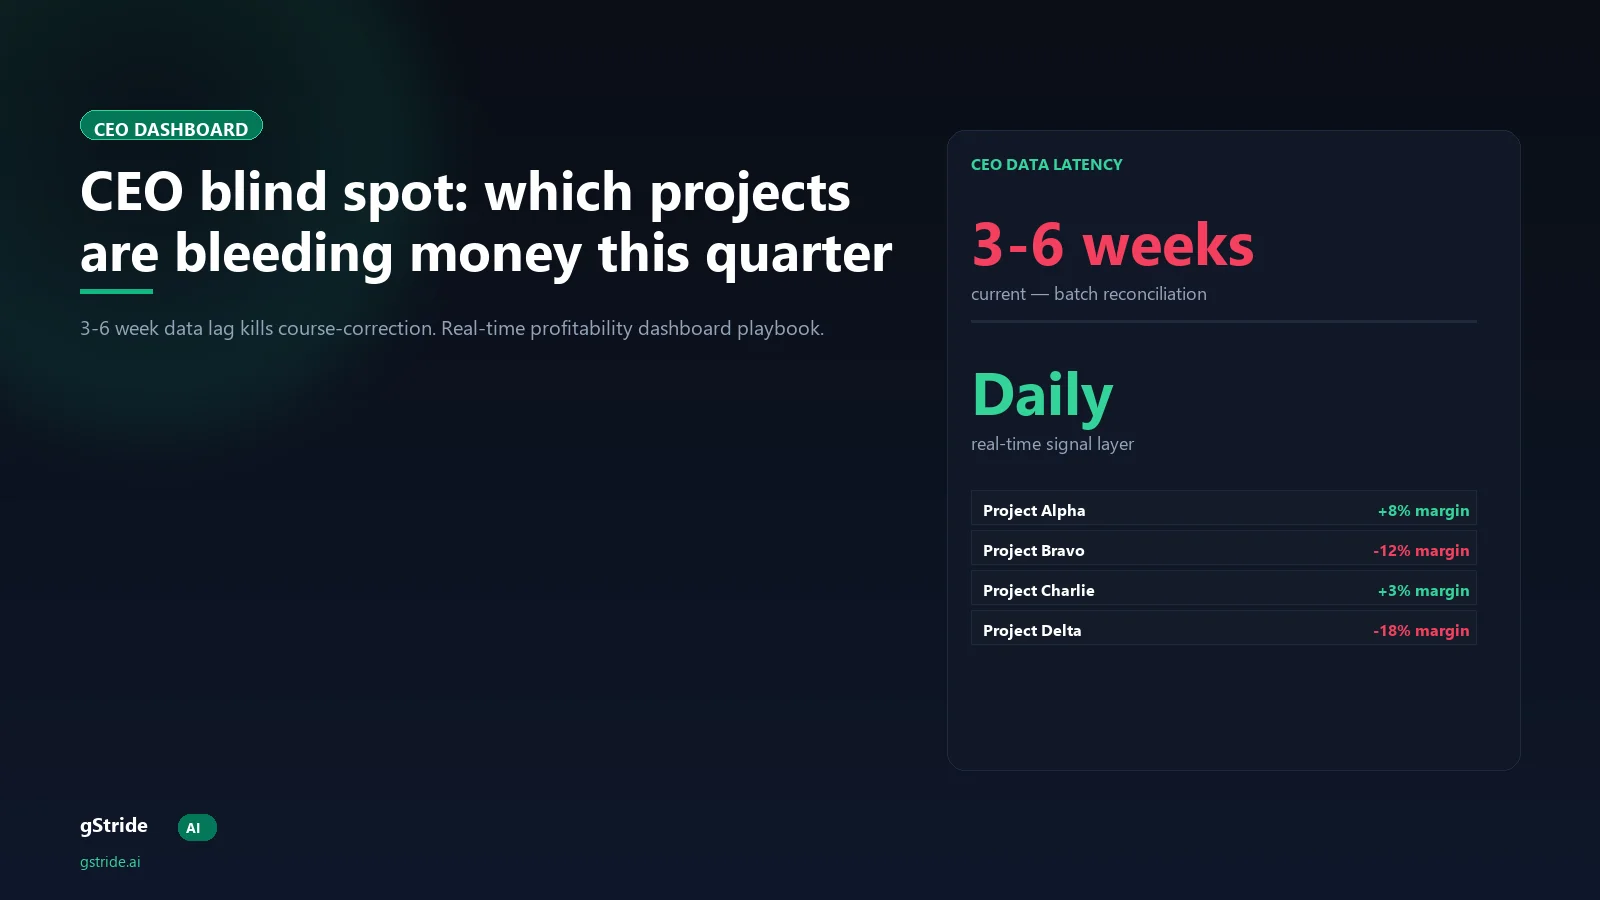
The pain — verbatim from the CEO call
"CEO cannot see which projects are profitable in real-time. By the time the accounting team compiles the data, CEO interest has already faded. Accounting/finance data takes days to compile — the report arrives but the moment to act is gone."
— A CEO running a 7-year-old Ahmedabad real estate tech firm, on an advisor call, April 2026
The CEO who said this is not blaming the accounting team. The accounting team is doing exactly what their tooling lets them do: monthly close, monthly export, monthly reconciliation. The frustration is structural — the data exists in the company, the right people are looking at the right numbers, but the latency from operational event to CEO desk is measured in weeks, and weeks is exactly the time horizon in which project decisions matter.
Why the data arrives late — 4 structural reasons
1. Manual accounting reconciliation runs at month-end
Invoice cycles, expense submissions, payroll batch, and revenue recognition all reconcile on a monthly cadence in most small Indian IT services shops. The accounting team cannot produce a mid-month margin view because half of the inputs (expense reports, milestone-based revenue, contractor invoices) have not yet landed in the system. The earliest defensible per-project margin number is the 5th to 10th of the following month.
2. Project-time data lives in a separate timesheet silo
Hours allocated to a project sit in a timesheet system. Cost-per-hour sits in HRMS. Revenue sits in the project record or accounting ledger. To produce a per-project margin number, someone has to export from each system, join on employee-and-project keys, and aggregate. At most small Indian IT services shops this is a manual quarterly pass, or in the best case a monthly pass. Mid-week per-project margin requires the join to happen continuously, which requires the three systems to read from a shared data layer.
3. Headcount cost is averaged across the team, not allocated per project
The CFO knows the company's monthly payroll cost. The CFO does not, in most cases, know the per-project allocated cost on a Tuesday-of-week-three basis, because the allocation calculation has not been run. When the CEO asks "is project X over budget?" the honest answer is "we will know at month-end after the allocation runs." That answer is correct, and it is also useless for the decision the CEO is trying to make.
4. CFO and CEO get the data after finance review
Even after month-end reconciliation runs, the per-project margin numbers go through CFO review (audit-correctness, accrual treatment, exception flagging) before the CEO sees them. That review adds 1 to 3 weeks. By the time the CEO opens the report, the quarter is over, the post-mortem is the only available conversation, and the time to course-correct any individual project is gone.
The cost of late-signal awareness
Across the small Indian IT services shops we have piloted with, late-signal awareness costs roughly 8-14% of annual project margin. The mechanism is well-understood:
- A project goes over budget in week 3 of a 12-week engagement (typical pattern: scope creep, an under-estimated module, or a key engineer pulled into a different priority).
- The project continues to bleed for another 6-8 weeks before the CEO sees the margin report.
- Course-correction at week 9 saves roughly 25-30% of the remaining over-run (re-scope conversation with client, re-staff, or escalate).
- Course-correction at week 12 (post-mortem after the quarter closes) saves zero.
Three projects per year drifting over budget by Rs 4-6 lakh each, undetected for an extra 8 weeks each, compounds to Rs 12-18 lakh of annual margin erosion on a Rs 1.5-2 cr revenue book. That is a 6-10% annual margin hit purely from data latency, not from project performance. Performance was as it was; the only thing that changed was when the CEO learned about it.
What real-time project profitability surfaces
The platform shape that closes the gap reads from the same three sources but on a live data layer instead of batch reconciliation. The CEO dashboard surfaces:
- Per-project margin tile — current running margin as of yesterday's close, against budgeted margin at project kick-off. Green / amber / red threshold by per-project policy.
- Headcount overlay — how many engineers are currently allocated, at what blended cost rate, on each project. Surfaces over-staffing and under-staffing within the week.
- Burn-rate chart — cumulative project cost over time vs revenue commitment. Visible bend in the curve when burn exceeds plan.
- Alert threshold — automatic flag when per-project margin drops below a configurable threshold (typically 12-15% absolute margin or 25% relative to plan).
- Top-three risk projects — daily ranked list of the three projects most likely to slip in the next 4 weeks, based on current burn vs remaining scope.
None of this is new data. The data exists in the company today. The only change is the latency from operational reality to CEO visibility — measured in days instead of weeks.
4-week deployment playbook
Week 1 — Connect data sources
Connect HRMS for per-employee cost rate, the productivity-intelligence agent for project-time allocation, and the project record system for revenue commitment. The agent reads project-time allocation automatically from the developer's IDE, ticket system, and calendar metadata — no manual timesheet step. HRMS connector reads the per-employee cost rate from payroll. The project record holds the revenue commitment from the original SOW.
Week 2 — Validate on historical projects
Run the live margin calculation against three historical projects where the CFO already knows the answer from the audited monthly close. Reconcile until the live calc matches the audited result within 4-6%. The variance comes from end-of-month accruals (invoiced-but-not-booked revenue, late expense reports, payroll variance for partial-month joiners) that the daily signal cannot account for in real time. 4-6% variance is well within acceptable bounds — the daily signal flags margin slips that are 15-30% in magnitude, far above the variance noise.
Week 3 — Ship the CEO dashboard
Top-five live projects on a single screen, top-three risk projects on a stat tile, alert thresholds configured per project. The CEO sees the dashboard daily; the platform sends a digest at 8 AM IST with overnight changes flagged. Most CEOs open the dashboard in their first 15 minutes of the day and check the risk tile.
Week 4 — Ship role-based views
CFO sees the audited monthly reconciliation as before, with a real-time live view as an operational supplement (not a replacement). CTO sees engineering velocity vs allocated cost. Project managers see per-task burn vs hour budget on their projects. The platform integrates into the weekly leadership review as a single source of truth. Details on the role-based dashboard split are in our workforce intelligence dashboard guide.
CFO + CEO dashboard split — who sees what
| Role | Primary view | Update cadence | Decision horizon |
|---|---|---|---|
| CEO | Per-project margin grid + top-three risks | Daily, 8 AM IST | This week / next week course-correction |
| CFO | Audited monthly reconciliation + live view as supplement | Monthly close + daily supplement | Month-end + accrual treatment + audit |
| CTO | Engineering velocity vs allocated cost per team | Daily | Resource allocation + sprint-level intervention |
| Project manager | Per-task burn vs hour budget on owned projects | Daily | Task-level scope and re-assignment |
The four views ship from a single underlying data layer. They are not duplicate reports; they are different cuts of the same operational reality, surfaced at the latency that matches each role's decision horizon.
What this changes for the founder we opened with
The Ahmedabad CEO who said "by the time the accounting team compiles data, CEO interest has faded" is articulating a CEO-data lag problem that every small Indian IT services shop runs by. The lag is not anyone's fault — the accounting team is doing exactly what their tooling supports — but it is also not something accounting effort can close. The architectural shift from batch reconciliation to live data layer is the only mechanism that closes the gap.
For the CEO, the operational change is: project decisions move from quarterly post-mortem to weekly course-correction. Bleeding projects get re-scoped in week 3, not in week 13. The 8-14% annual margin erosion from late-signal awareness compresses by 60-80%, because course-correction at week 4-6 saves 25-30% of the remaining over-run instead of zero. The CEO regains the visibility loop that small IT services shops have been operating without for the entire 2015-2025 decade.
None of this requires the accounting team to work harder or the project managers to track time more diligently. The work happens at the data-layer level — three systems that already exist in the company, connected on a live read instead of monthly batch.
Free: 5-Signal Productivity Self-Audit Worksheet
The team-level signal layer that feeds project profitability. 30-min audit on focus depth, commit cadence, meeting load, flow-state minutes, blocker recovery. PDF + Google Sheets calc. For Ops Heads, Founders, Eng Managers at 25-300 emp Indian IT shops.
Free: CISO Procurement Checklist for CEO Dashboards
10 questions every CEO and CFO should ask before signing — data residency, real-time vs batch reconciliation, role-based access, audit log, SCIM/SSO, breach SLA, sub-processors, right to audit. Includes scoring rubric and pass / hold / walk thresholds.
Further reading on gStride
Frequently asked questions
Why do IT services CEOs see project profitability 3-6 weeks late?
Four structural reasons compound. Manual accounting reconciliation runs at month-end, not daily — invoice cycles, expense submissions, and payroll batch on a calendar that lags the operational week. Project-time data lives in a separate timesheet system from the financial ledger, with a manual export-import per cycle. Headcount cost is averaged across the team, not allocated per project, so per-project margin is unknowable until the month-end allocation pass. And the CEO sees the data only after finance review, which adds 1-3 weeks on top.
What does real-time project profitability actually surface?
Per-project margin updated daily, not monthly. The signal layer reads project-time allocation from the productivity-intelligence agent, headcount cost from HRMS, and revenue commitment from the project record. The platform multiplies allocated hours by per-employee cost rate, subtracts from billable rate, and surfaces the running margin per project on a live tile. CEOs see margin erosion in week 2 or 3 of a 12-week project, when there is still time to re-scope, re-staff, or escalate to the client.
What is the cost of late-signal awareness?
Across small Indian IT services shops we have worked with, late-signal awareness costs roughly 8-14% of annual project margin. A project that goes over budget in week 3 of 12 typically bleeds for another 6-8 weeks before the CEO sees it. Course-correction at week 9 saves 25-30% of the remaining over-run; course-correction at week 12 saves zero. Three projects per year drifting over budget by Rs 4-6 lakh each compounds to Rs 12-18 lakh of annual margin erosion on a Rs 1.5-2 cr revenue book.
How does this differ from a CFO dashboard?
A CFO dashboard answers "what was last month's margin?" A real-time project profitability dashboard answers "what is this week's margin?" The CFO view is correct-and-late; the operational view is correct-enough-and-now. Both have a role. The signal layer typically ships role-based views: the CEO sees a per-project margin grid; the CFO sees the audited monthly reconciliation; the CTO sees engineering velocity vs allocated cost; the project manager sees task-level burn vs hour budget.
What is the 4-week deployment for the dashboard?
Week 1: connect HRMS for per-employee cost rate, productivity-intelligence agent for project-time allocation, and project records for revenue commitment. Week 2: validate the per-project margin calculation on three historical projects where the CFO already knows the answer, until the live calc matches within 4-6%. Week 3: ship the CEO dashboard with the top-five live projects and the top-three risk projects. Week 4: ship the CFO and CTO views, train the project managers on the burn-vs-budget tile, and integrate the platform into the weekly leadership review.
What about projects with mixed onsite and offshore teams?
The signal layer treats each allocation at the team-member level. An onsite developer in the UK at a Rs 4,80,000/month cost rate and an offshore developer in Hyderabad at Rs 1,20,000/month sit on the same project with two different per-hour cost rates. The platform reads the rates from HRMS, the allocations from the productivity-intelligence agent, and applies both to the per-project margin calculation. The CEO sees the blended per-project margin daily, with a drill-down to the onsite-vs-offshore mix when the margin slips.
How accurate is the daily margin signal?
Within 4-6% of the audited monthly close, across small Indian IT services shops we have piloted with. The 4-6% variance comes from end-of-month accruals (invoiced but not yet booked revenue, late expense submissions, payroll variance for partial-month joiners) that the daily signal cannot account for in real time. For operational course-correction the 4-6% variance is well within acceptable bounds — the daily signal flags margin slips that are 15-30% in magnitude, far above the variance noise.
Does this require employees to log time manually?
No. The productivity-intelligence agent reads project-time allocation from the developer's IDE, ticket system, and calendar metadata — no manual timesheet entry. The signal is captured operationally and surfaces in the CEO dashboard automatically. Manual timesheets remain available as a corrective layer for non-engineering roles (sales, support) where operational capture is sparser, but the primary signal for engineering is automatic.
See the live CEO dashboard on real project data
30-minute walkthrough of the per-project margin grid, top-three risk projects, and burn-rate chart on a small Indian IT services book. Live data layer, not batch reconciliation.
Book a 30-min CEO demo Read the dashboard guideQuotes from a private advisor call have been anonymised — the Ahmedabad CEO referenced gave the founder feedback in a private call and is not publicly named. Operational margin numbers (8-14% annual erosion) are blended ranges from pilot rollouts and customer-confirmed data through Q1 2026. Variance bounds (4-6% live vs audited) are validated on three to five pilot reconciliations per customer; individual variance depends on accrual patterns and data hygiene.